
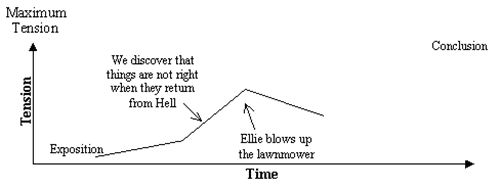
Students draw a line graph to show the rise and fall in excitement level of the plot. (See example below.) OR using the main events of the book (which the teacher may provide), give each event a rating e.g. 1 – not exciting....5 – very exciting. Plot this information on a line graph. Drawing story graphs helps students to understand the structure of narrative texts.
© Ministry of Education, Wellington, New Zealand (First published 1998)
A story map is a strategy that uses a graphic organiser to help students learn the elements of a book or story. By identifying story characters, plot, setting, problem, and solution, students read carefully to learn the details. There are many different types of story map graphic organisers. The most basic focus on the beginning, middle, and end of the story. More advanced organisers focus more on plot or character traits. It is an important task for all children, but especially for ELL students, to learn how to distinguish the main story from the unimportant material. Using story maps can improve students' comprehension and provide students with a framework for identifying the elements of a story. They can also help students of varying abilities to organise information and ideas efficiently. The Reading rocket website provides examples based on books at different levels and in different learning areas.
Watch this video to see year 12 english students using a story graph in the classroom
Teaching and learning sequence planning examples:
Secondary level:
Published on: 19 Jan 2018